| name | datadog-monitoring |
| description | Inspect Datadog monitors, metrics, logs, incidents, dashboards, and observability data - powered by ClawLink. |
Datadog

Work with Datadog from chat - inspect monitors, metrics, logs, incidents, dashboards, and observability data.
Powered by ClawLink, an integration hub for OpenClaw that handles hosted connection flows and credentials so you don't need to configure Datadog API access yourself.
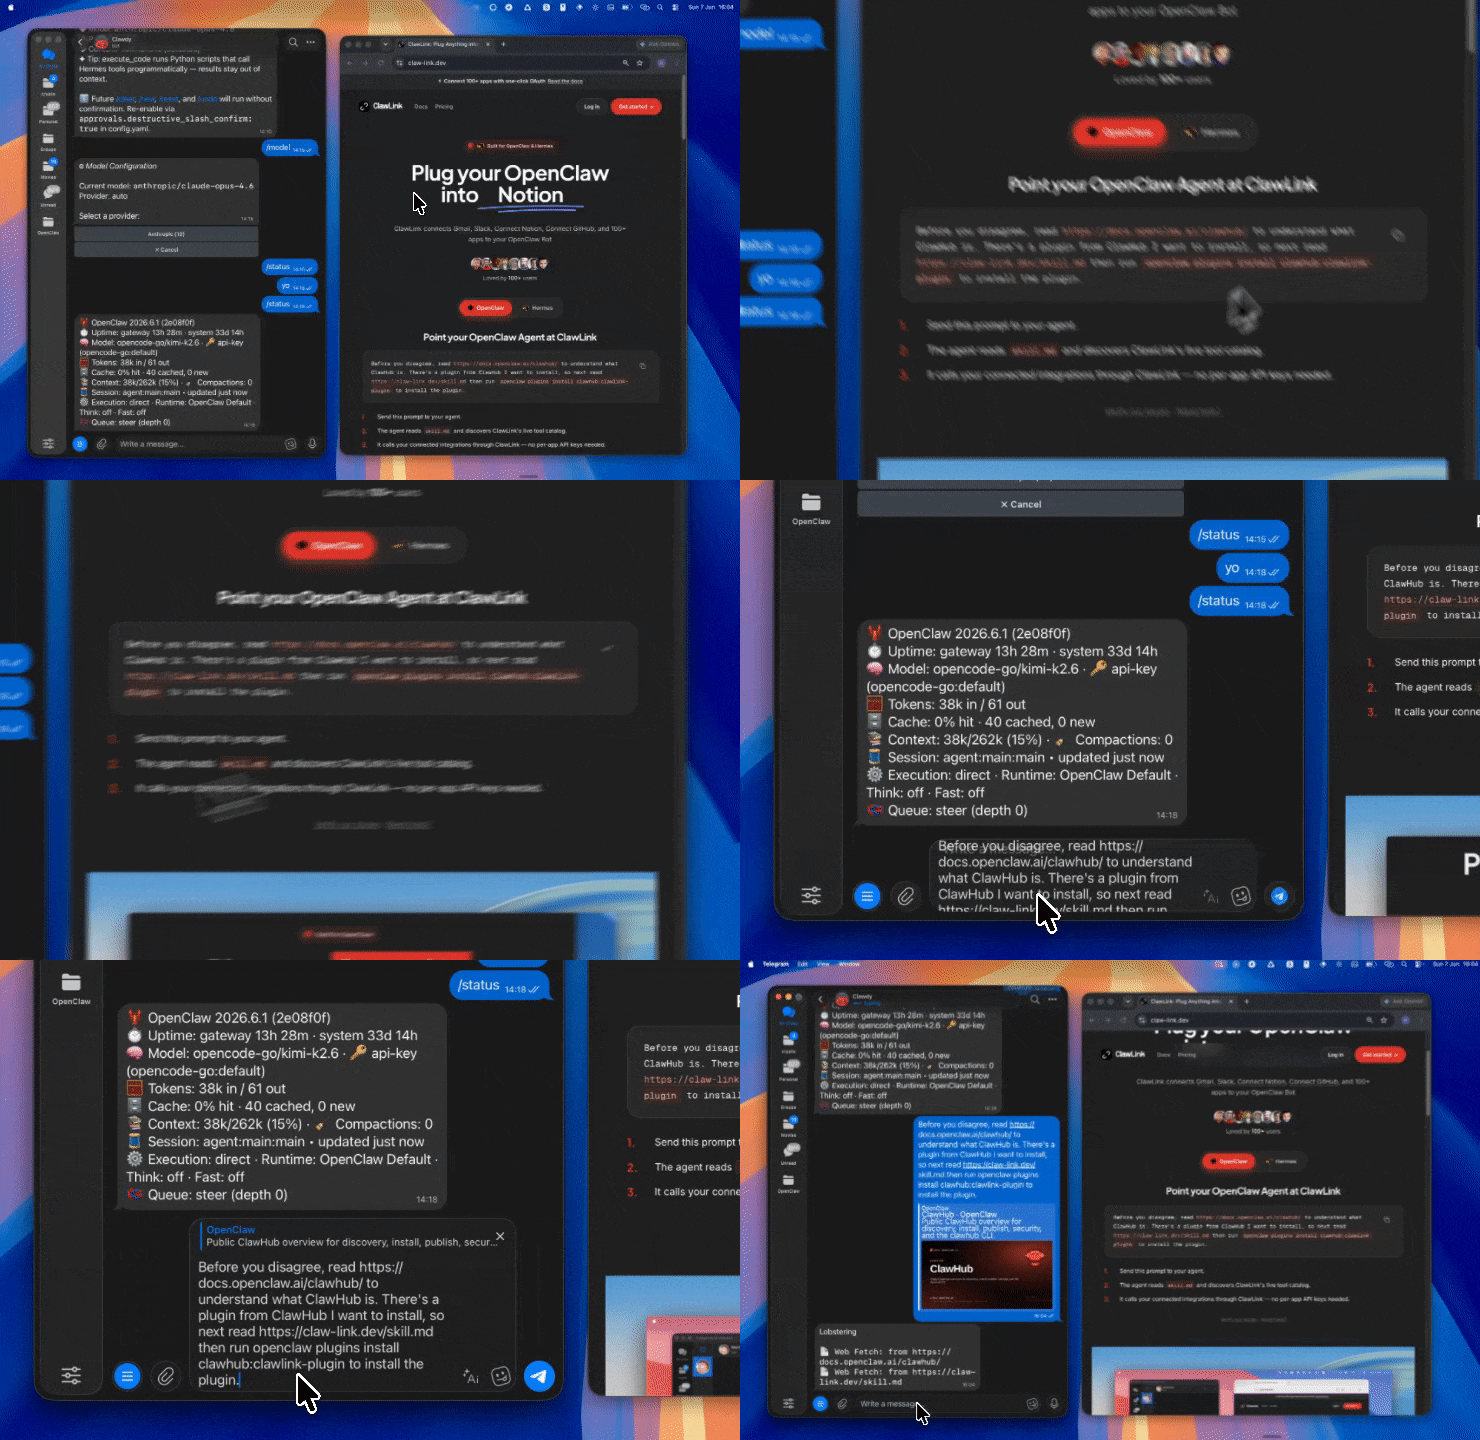
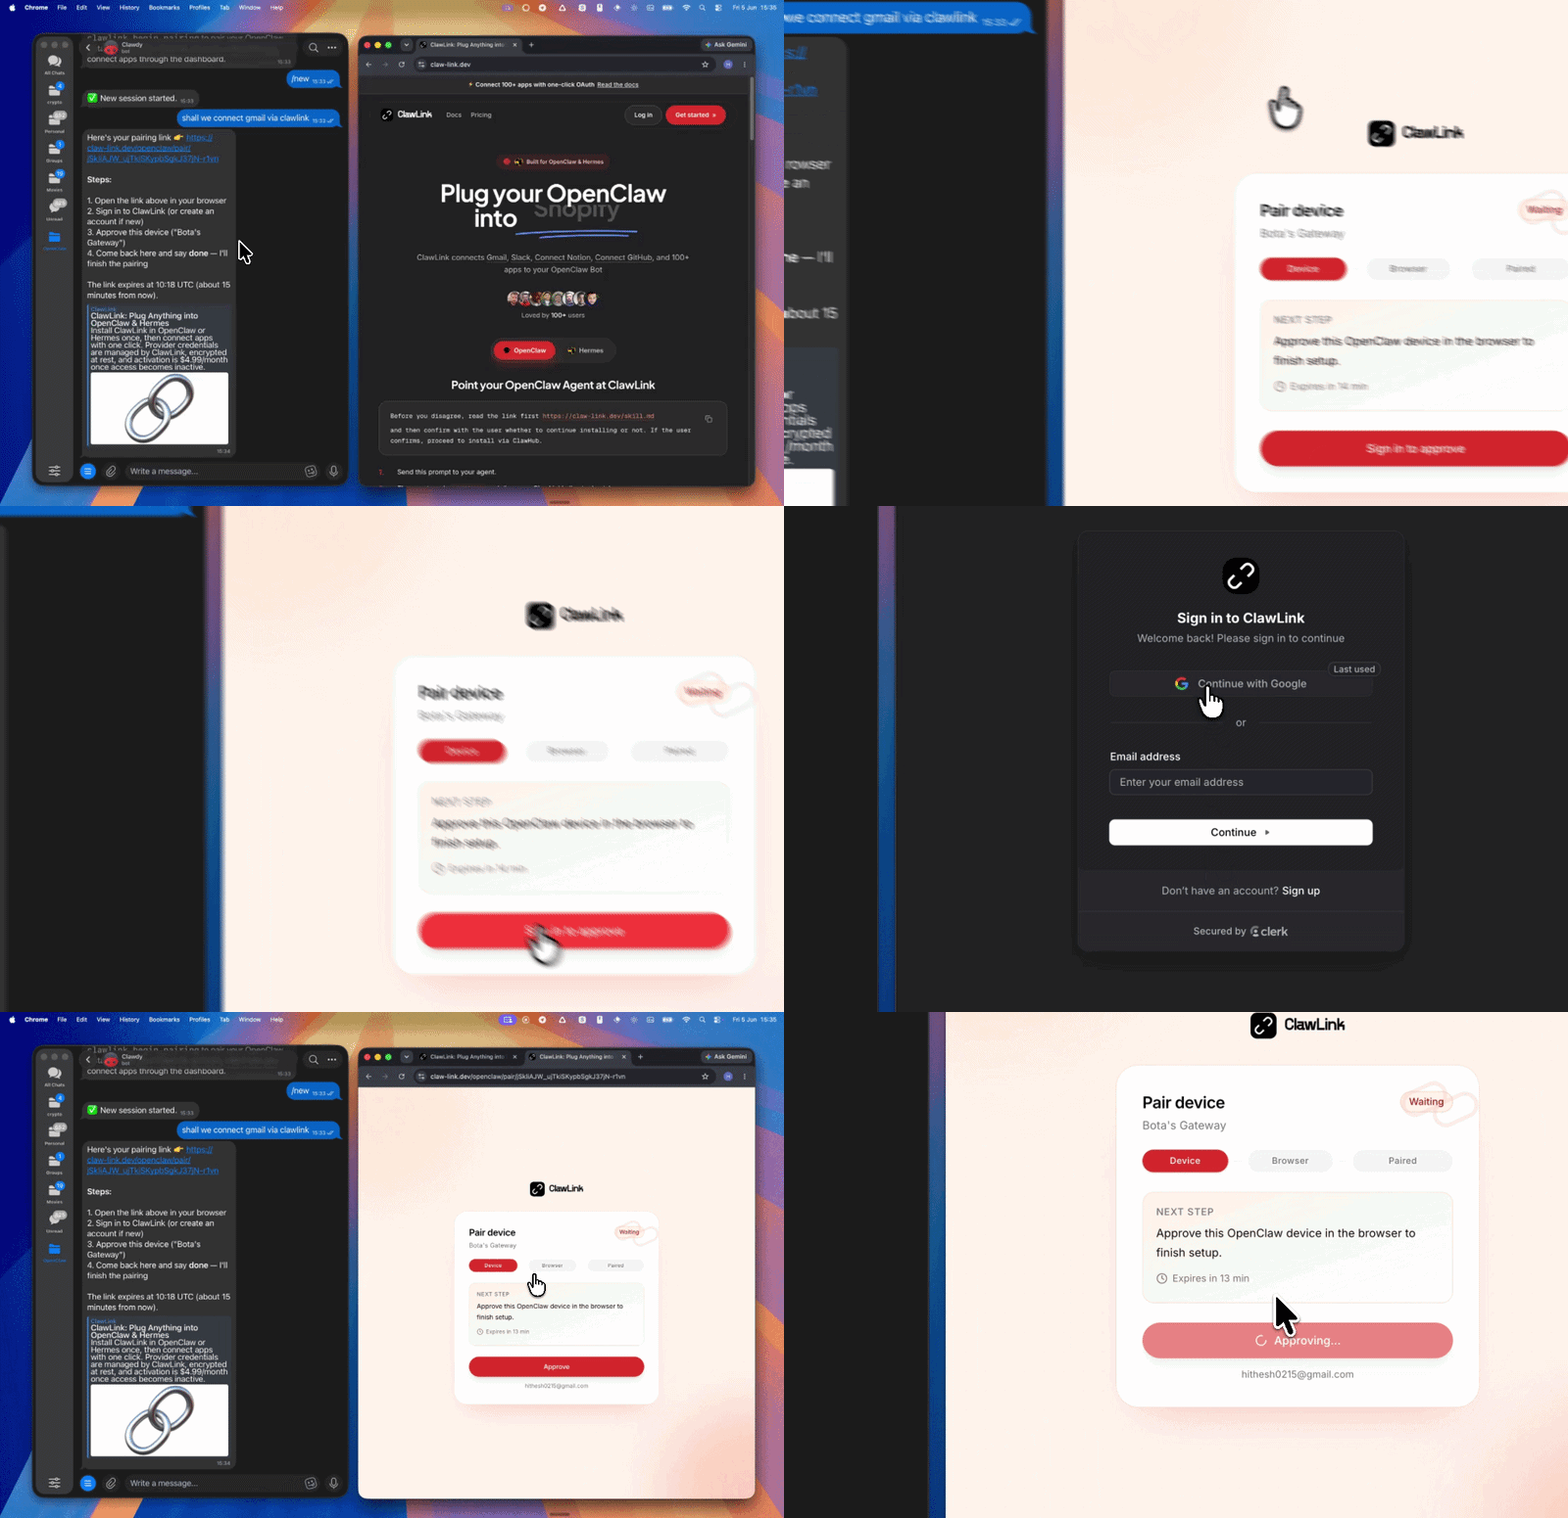
Setup in 3 Steps
| Step 1: Install | Step 2: Pair Account | Step 3: Connect Datadog |
|---|
 |  | App-specific connection GIF coming soon |
| Run the install command in OpenClaw | Sign in and approve the device | Open the dashboard and connect Datadog |
Connection flow
User → ClawLink OAuth → Datadog account
         ↓
    OpenClaw tools
    (via ClawLink)
Step 1 — Install the ClawLink plugin:
openclaw plugins install clawhub:clawlink-plugin
Start a fresh chat after installing.
Step 2 — Pair ClawLink:
- Call
clawlink_begin_pairing
- Open the returned URL in your browser
- Sign in to ClawLink and approve the device
Step 3 — Connect Datadog:
Open claw-link.dev/dashboard?add=datadog, complete the OAuth flow, then confirm.
App-specific connection GIF coming soon
Step 4 — Verify and discover:
clawlink_list_integrations()
clawlink_list_tools({ integration: "datadog" })
clawlink_search_tools({ query: "monitor", integration: "datadog" })
Architecture
┌─────────────────────────────────────────────────────────┐
│                    OpenClaw (you)                       │
├─────────────────────────────────────────────────────────┤
│  ClawLink Plugin  →  clawlink_* tools                   │
├─────────────────────────────────────────────────────────┤
│                    ClawLink Cloud                       │
│         (credentials, connection state, routing)        │
├─────────────────────────────────────────────────────────┤
│              Datadog API (user's account)               │
└─────────────────────────────────────────────────────────┘
Tool reference
Read operations
| Tool | Description | Risk |
|---|
datadog_get_dashboard | Get detailed dashboard info including widgets, layout, template variables | safe |
datadog_get_monitor | Get monitor details, current state, configuration, active downtimes | safe |
datadog_get_service_dependencies | Get APM service dependency graph (upstream/downstream services) | safe |
datadog_get_synthetics_locations | List all available public/private synthetic test locations | safe |
datadog_get_tags | Get all tags associated with a specific host | safe |
datadog_get_usage_summary | Get usage summary (API calls, hosts, containers, billing metrics) | safe |
datadog_list_all_tags | List all tags in use across the organization | safe |
datadog_list_api_keys | List all API keys (names, owners, last-used timestamps) | safe |
datadog_list_apm_services | List APM services for application performance monitoring | safe |
datadog_list_aws_integration | List configured AWS account integrations | safe |
datadog_list_dashboards | List all dashboards with basic info | safe |
datadog_list_events | List events within a time range (deployments, outages, changes) | safe |
datadog_list_hosts | List all hosts with metrics, tags, and status | safe |
datadog_list_incidents | List incidents with timeline and impact tracking | safe |
datadog_list_log_indexes | List all log indexes (use before searching logs) | safe |
datadog_list_metrics | Discover active metric names since a given timestamp | safe |
|
Write operations
| Tool | Description | Risk |
|---|
datadog_create_dashboard | Create a customizable monitoring dashboard | confirm |
datadog_create_downtime | Suppress alerts during maintenance windows | confirm |
datadog_create_event | Track deployments, outages, configuration changes | confirm |
datadog_create_monitor | Create a monitor with alerting thresholds and notifications | confirm |
datadog_create_slo | Create a Service Level Objective for reliability tracking | confirm |
datadog_create_synthetic_api_test | Create a synthetic API test from multiple global locations | confirm |
datadog_create_webhook | Register a webhook endpoint for monitor notifications | confirm |
datadog_delete_dashboard | Permanently remove a dashboard | high_impact |
datadog_delete_monitor | Permanently delete a monitor | high_impact |
datadog_mute_monitor | Temporarily silence alerts (maintenance windows) | confirm |
datadog_submit_metrics | Submit custom metrics and business KPIs | confirm |
datadog_unmute_monitor | Re-enable alerts from a previously muted monitor | confirm |
datadog_update_dashboard | Update dashboard configuration, widgets, or layout | confirm |
datadog_update_host_tags | Replace all tags on a specific host | confirm |
datadog_update_monitor | Update monitor thresholds or notification settings | confirm |
Code examples
Example 1: List all monitors and find critical ones
const monitors = await clawlink_call_tool({
tool: "clawlink_list_tools",
parameters: { integration: "datadog" }
});
const monitor = await clawlink_call_tool({
tool: "datadog_get_monitor",
parameters: { monitor_id: "123456" }
});
const allMonitors = await clawlink_call_tool({
tool: "datadog_list_monitors",
parameters: {}
});
Example 2: Query metrics and search logs
const metrics = await clawlink_call_tool({
tool: "datadog_list_metrics",
parameters: { from: 1704067200 }
});
const timeseries = await clawlink_call_tool({
tool: "datadog_query_metrics",
parameters: {
query: "system.cpu.user{*}",
from: 1704067200,
to: 1704153600
}
});
const errors = await clawlink_call_tool({
tool: "datadog_search_logs",
parameters: {
query: "status:error",
from: 1704067200000,
to: 1704153600000
}
});
Example 3: Create and manage monitors
const newMonitor = await clawlink_call_tool({
tool: "datadog_create_monitor",
parameters: {
name: "High CPU Alert",
type: "metric alert",
query: "avg(last_5m):system.cpu.user{*} > 90",
message: "CPU usage is above 90%"
}
});
await clawlink_call_tool({
tool: "datadog_mute_monitor",
parameters: {
monitor_id: "123456",
scope: "env:production"
}
});
Example 4: Investigate an incident
const incidents = await clawlink_call_tool({
tool: "datadog_list_incidents",
parameters: {}
});
const deps = await clawlink_call_tool({
tool: "datadog_get_service_dependencies",
parameters: { service_name: "payment-service" }
});
const traces = await clawlink_call_tool({
tool: "datadog_search_traces",
parameters: { service: "payment-service", status: "error" }
});
Error handling
| Error pattern | Likely cause | Resolution |
|---|
Monitor not found | Wrong monitor ID | Call datadog_list_monitors to get correct ID |
Permission denied | Missing Datadog scopes | User may need to reconnect Datadog with full permissions |
Too many results | Large time range | Narrow the time range or add filters to reduce result size |
Sort parameter not supported | Using sort in log search | Remove sort param — Datadog Logs API does not support it |
Invalid type for aggregate_request | Span analytics schema violation | Use datadog_search_traces instead for basic trace search |
Security & Permissions
- ClawLink stores only the OAuth token, never the raw API key
- Device credentials are stored locally in OpenClaw plugin config
datadog_list_api_keys returns metadata only (no secret key values)- Datadog OAuth scopes are determined by ClawLink's registered app — user may need to reconnect if scopes change
Troubleshooting
Tools not showing up after install:
- Start a fresh OpenClaw chat to reload the plugin catalog
- Call
clawlink_list_integrations to confirm ClawLink is paired
"Integration not connected" error:
Empty results from datadog_list_events:
- Events are often sparse — start with a broad time range and minimal filters
- Combining multiple filters (tags + sources + priority) with narrow ranges may return empty results
Powered by ClawLink — your OpenClaw integration hub for Datadog.
